ARR vs ACV: Differences in Metrics & Formulas (Annual Contract Value vs Annual Recurring Revenue) for SaaS

You may already know that Annual Recurring Revenue (ARR) and Annual Contract Value (ACV) are both revenue-related metrics, but they're not interchangeable.
I see them tossed around board rooms and exec team meetings all the time, but I don’t see many companies truly leveraging these statistics to improve their business models. The confusing nature of so many metrics can cause confusion and frustration, so you must clearly understand these data points and how they can help your company grow.
SaaS business success is based on subscription models, revenue growth, average revenue, and total amounts of recurring income. Strong ARR and ACV numbers support a growth model and provide key performance indicators (KPIs) to drive that expansion, but they do so differently. Read on to learn where each metric is most useful and how you can apply them.
Before we dive into the details, it’s essential to understand that you calculate ARR and ACV at the end of a financial reporting period. It can be dangerous to create forecasts or projections without complete data.
So, want to start making accurate projections based on real-time data? Let’s get started!
What Are ACV and ARR?
Even if you’ve read our past articles on sales metrics, now’s a good time for a quick refresher on what we mean by the acronyms ACV and ARR.
What is ACV?
Typically, SaaS businesses use ACV with a subscription-based model. Most of these businesses bill their customers annually or for periods longer than a year. However, you can still calculate ACV if you bill customers monthly, quarterly, or semi-annually.
What is ARR?
When tracking sales metrics, invest time calculating annual recurring revenue (ARR). You’ll typically break down ARR reports by new customers, existing customers, customers on a promotional plan, generated from upgrades and add-ons, lost to downgrades, and churn rate.
What’s the Difference Between ACV and ARR?
ACV and ARR are two essential metrics used in the SaaS business model. However, they measure revenue differently, so business leaders must learn the difference, especially those in the startup phase of business growth.
Here are three key differences:
- ACV measures a single account. ARR measures the revenue value of all subscription-based contracts.
- ACV’s formula can be varied by including one-time fees or not. ARR formula is standardized.
- ACV is best viewed with other metrics. ARR is a standalone metric showing revenue growth or loss.
Another way to distinguish the two is by the adjectives that describe them.
- ACV can be described as useful, timely, revealing, and actionable.
- ARR can be described as powerful, long-term, and strategic.
ARR is a growth statistic measured annually, so a business needs to be around for a number of years before effectively using ARR as a key performance indicator. Use the similar Monthly Recurring Revenue (MRR) value for more immediate measurement.
Additionally, utilizing our revenue growth calculator can offer insightful projections and analytics to complement these metrics.
ACV is a revenue statistic used by sales managers and marketing teams to compare and contrast different accounts, industries, market segments, sales reps, and groups to determine the most profitable areas for marketing and sales activities. It can also be a good KPI for sales reps since an increasing ACV each month typically means the sales rep is selling bigger deals, more add-ons, or effectively selling without reducing revenue with special offers or discounts.
While ARR includes all customers on monthly, quarterly, and annual subscriptions, frequently, ACV reports will break those out into categories.
When and How to Use ACV vs ARR
OK, we know how these two metrics are different ... the next step is understanding when to use each, and how to actually go about it.
How to Calculate Annual Contract Value (ACV)
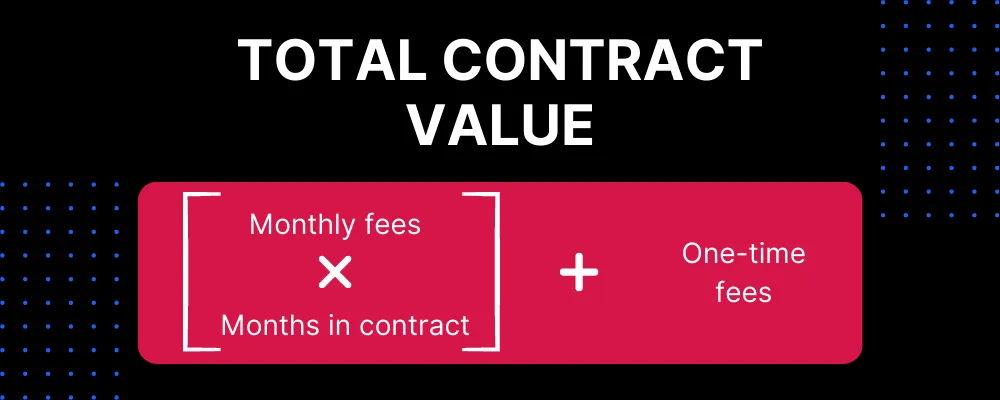
To calculate ACV, you must first calculate TCV (Total Contract Value).
Total Contract Value (TCV) = Monthly Fees x Contract Term Length in Months + Any One-Time Fees (including onboarding, implementation, or consultation fees)
 |
Then, use this ACV formula:
Annual Contract Value (ACV) = (TCV - One Time Fees) / Total Years in the Contract
 |
Let’s say Green Meadows, a Miami-based residential care facility for senior citizens, signs a 3-year contract with SeniorPlus, a SaaS system to handle all resident/patient records. They sign up for:
- 30 full licenses at $75 each per month for their administration and medical staff
- A $3,000 training package add-on for their staff
- A $500 per month tech support package
- A $10,000 implementation fee
Total Monthly Subscription Fees = ($75 x 30 licenses) + $500 tech = $2,750
Total Value = ($2,750 x 36mo.) + $3,000 training + $10,000 implementation
Total Value = 99,000 + $3,000 + $10,000 implementation = $112,000
Annual Contract Value (ACV) = $99,000 / 3 years = $33,000
A sales manager or analyst may look at individual ACVs but also all ACVs in one category.
Taking our above example as Customer A, let’s say that SeniorPlus has two more customers in the Miami area.
- Customer B, “Sunny Pastures,” is an identically-sized facility to Green Meadows but has been with the SeniorPlus for three years and has just renewed its contract for another three. They don’t need the $500 tech support package anymore. Therefore, their monthly payment is $2,250, and their ACV is down to $27,000. Their Customer Lifetime Value (LTV) increases, but the ACV decreases.
- Customer C, “Shady Pines,” is a much smaller facility that has signed up for ten licenses of SeniorPlus, and signed a 3-year contract paying $85 per user ($850/month x 24 months = $20,400). With no add-ons, the ACV = $30,800 / 3 years = $10,200.
Here are some considerations around this scenario:
- These customers would be included in a “Regional ACV” list, showing an Average ACV of $23,400.
- Marketing research may identify Miami as a top target for more sales, using average ACV to target facilities.
- Given the fact that there is a minimum 36-month contract, the ACV can help determine what dollar amount SeniorPlus allocates to sales and marketing for the customer acquisition cost (CAC).
You may wonder why we calculate the TCV, which includes one-time fees, just to subtract them in the next step. We do this because it’s important to see the Total Contract Value. Also, each company may have a slightly different way of calculating ARR, so take the time to standardize a formula across your organization.
Using Annual Contract Value (ACV)
ACV is used to measure your sales team and customer success performance, and its use is much more straightforward than ARR. You’ll use ACV to grow your business by actively:
- Prioritizing the proper accounts
- Assessing how your reps are performing with big deals
- Dedicating the right resources to the deals that matter most
- Planning marketing and sales strategies to target specific industries or signature events
ACV is beneficial:
- As an indicator that it’s time to start an enterprise sales team (when there is a steadily growing amount of uncharacteristically high-ACV accounts)
- In assessing whether your sales team is effectively leveraging upselling and cross-selling
- During new sales or marketing roll-outs or testing, such as adjusting tiered pricing, selling a new bundle of add-ons on sale for a limited time, or charging a different onboarding fee
However, there are some cases where the ACV metric is insufficient or misleading. For example, this could occur when you need to show data that affects more than one contract, such as onboarding rates and churn. It could also happen when discussing long-term (multi-year) numbers and forecasts, or year-over-year annual revenue.
How to Calculate Annual Recurring Revenue
Annual Recurring Revenue is the total recurring revenue each year, typically meaning total revenue minus one-time fees. ARR is much more standardized than ACV.
As far as a comprehensive formula, it can become fairly complex because there are adjustments that you need to take into account, such as upgrades, add-ons, downgrades, or cancellations.
Generally, the ARR formula is as follows:
ARR = (overall customer contract revenue per year + recurring revenue from add-ons or upgrades during the year) - (revenue lost from cancellations or downgrades during the year) +/- any other adjustments (such as discounts taken for first-year subscriptions, subscription plan bundle discounts, etc.)
 |
Using Annual Recurring Revenue
The ARR metric shows the health of your customer base and can be used to predict future growth. It generally only considers multi-year contracts and does not consider the billing structure. Therefore, it is the metric used when measuring year-over-year revenue growth. A business always wants to see ARR growth.
ARR is frequently used when:
- Speaking with current or potential investors about company growth year-to-year
- At the company’s annual or quarterly board meetings. (For quarterly meetings MRR is typically used) to show movement in the right direction
- When measuring the company’s overall growth for industry publications such as the “Inc. 5000” Fastest Growing Companies magazine rankings
- Wanting to show overall company stabilization and growth to investors and potential customers who may be anxious about hiring a SaaS company that hasn’t proven itself as well-established
- When planning long-term financial investments that dip into company reserves or savings
- When applying for grants, loans, and financing programs that consider long-term stability and growth
- Making strategic company decisions, including major market expansions, enterprise sales, mergers, and acquisitions
Don’t use ARR as the basis for short-term (less than a year) decisions. Additionally, it shouldn’t be cited as a statistic measuring the results of a specific decision. Saying, “we rolled out a new product, and our ARR increased as a result,” is likely not the only cause of your ARR growth and can seem shortsighted to investors.
Elevate your revenue growth strategies by integrating CRM – find out how.
Using Monthly Recurring Revenue
As we mentioned earlier, MRR is useful for reporting at quarterly or monthly meetings, and is worth mentioning when using ARR could be misleading or inaccurate. MRR is predictable monthly revenue earned from active subscriptions. It is frequently split into:
- New MRR (revenue from new customers)
- Expansion MRR (revenue from existing company upgrades)
- Contraction MRR (revenue lost due to downgrades or churn)
In addition, MRR can frequently be used for observations that ARR can’t. You can determine your MRR one of two ways, making sure to do so consistently across your company.
- Calculate the MRR using the same formula as ARR but with a specific month’s numbers
- Calculate an average MRR by dividing the ARR by 12 months.
Which Metrics are Best for SaaS Companies to Track?
ARR and ACV are both essential metrics for SaaS companies to track. They provide different insights into the health of a business. ARR gives you a snapshot of your current recurring revenue, while ACV gives you a longer-term view of your customer relationships.
You should use both metrics and monitor them over time to get a complete picture of your SaaS company’s health. The complicated nature of constantly calculating these metrics can be done by a robust customer relationship management (CRM) system like Close. Close’s data analysis can help sales managers and salespeople accomplish their goals.
Want to see how it works in the real world? Try Close free for 14 days, or watch a free demo to see how it can help you track sales metrics and KPIs for your sales team and your business.